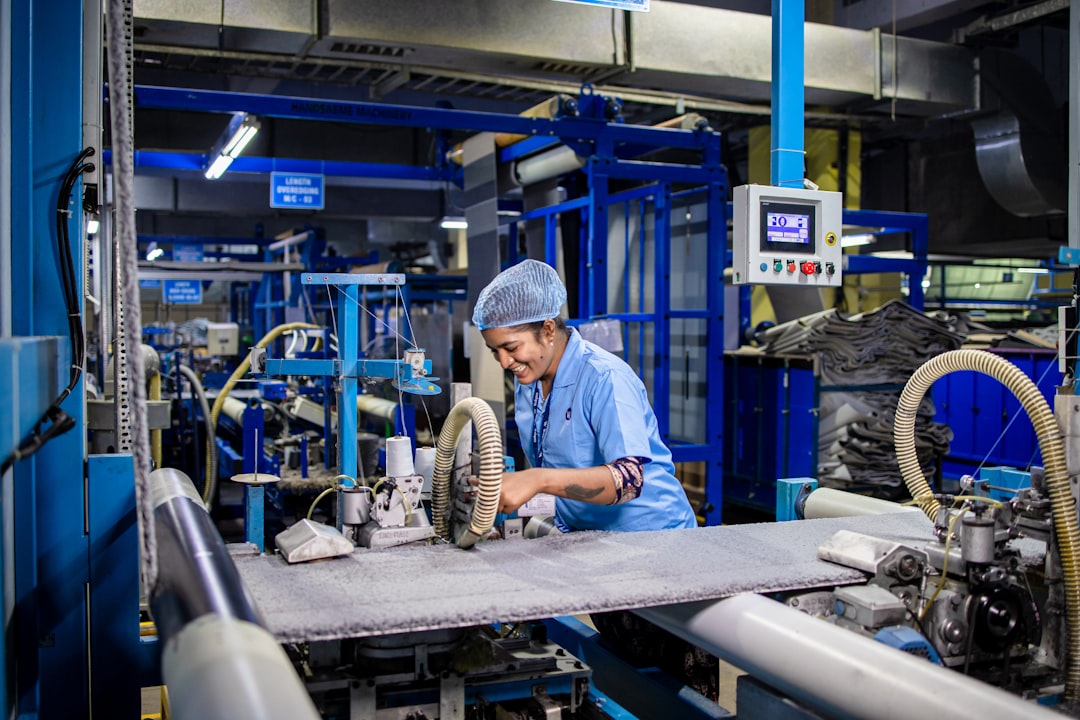
Smart factory KPIs are the measurable indicators that determine whether your manufacturing operations are truly performing at their peak in 2026. As Industry 4.0 technologies mature — from IoT sensors to AI-driven analytics — the ability to define, collect, and act on the right metrics has become a decisive competitive advantage. This guide covers the essential KPIs every smart factory should track, how to build effective dashboards, and the proven frameworks that turn raw data into operational excellence.
What Are Smart Factory KPIs and Why Do They Matter?
Smart factory KPIs are quantitative metrics used to evaluate the efficiency, quality, and performance of a connected manufacturing environment. Unlike traditional factory metrics, smart factory KPIs are collected in real time through IoT sensors, MES (Manufacturing Execution Systems), and ERP platforms — enabling instant decision-making rather than end-of-shift reporting.
The shift from reactive to predictive operations is what separates a smart factory from a conventional plant. According to a 2026 McKinsey report, manufacturers who implement a structured KPI framework tied to real-time data reduce unplanned downtime by up to 45% and improve overall equipment effectiveness (OEE) by 20–30% within 18 months of deployment.
There are three core reasons why smart factory KPIs matter more than ever:
- Visibility — Real-time dashboards eliminate information silos between the shop floor and management.
- Accountability — Clear metrics assign ownership of performance to teams and machines.
- Continuous improvement — Trend data fuels Lean, Six Sigma, and Kaizen initiatives with hard evidence rather than gut feeling.
Understanding which KPIs to track — and which to ignore — is the first step toward building a truly data-driven manufacturing operation. As explored in our guide on Digital Twin technology benefits for industry, the ability to simulate and monitor performance in real time is now a baseline expectation for competitive manufacturers.
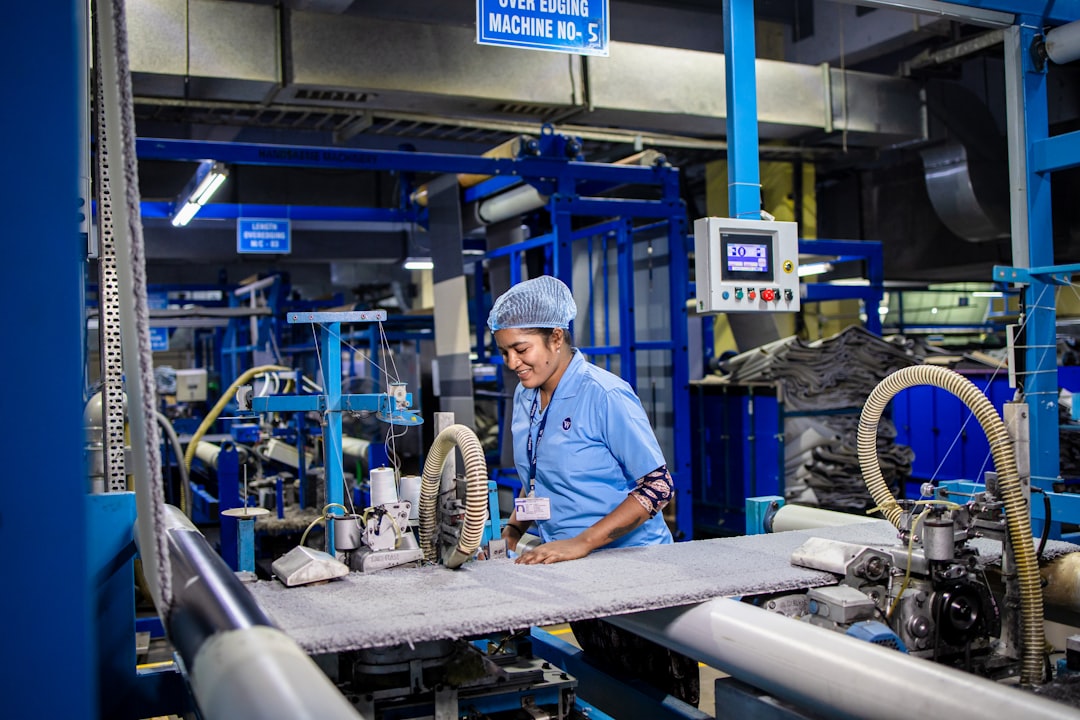
The 5 Core Categories of Smart Factory KPIs
Smart factory performance measurement is best organized into five strategic categories, each targeting a different dimension of manufacturing excellence. Grouping KPIs this way ensures that no critical area is overlooked and that every metric ties back to a business outcome.
1. Availability & Uptime KPIs
Availability KPIs measure how often your production assets are actually running versus their planned operating time. The most critical metric in this category is OEE (Overall Equipment Effectiveness), which combines availability, performance, and quality into a single score. A world-class OEE benchmark sits at 85%, though most plants start between 40–60% and improve from there.
- Machine Uptime Rate — Percentage of scheduled time a machine is operational.
- Mean Time Between Failures (MTBF) — Average time between equipment breakdowns.
- Mean Time to Repair (MTTR) — Average duration to restore a machine after failure.
- Planned Maintenance Compliance — Percentage of scheduled maintenance tasks completed on time.
2. Quality & Defect KPIs
Quality KPIs track how consistently your production meets specifications. These metrics are directly linked to customer satisfaction and warranty costs. The First Pass Yield (FPY) — the percentage of units produced correctly without rework — is the gold standard quality KPI in smart manufacturing environments.
- First Pass Yield (FPY) — Units passing quality checks on the first attempt.
- Defects Per Million Opportunities (DPMO) — Six Sigma standard for process quality.
- Scrap Rate — Percentage of production lost to irreparable defects.
- Customer Return Rate (CRR) — Units returned by customers due to quality issues.
3. Throughput & Efficiency KPIs
Throughput KPIs measure how much output your plant produces relative to its inputs. These metrics reveal bottlenecks, capacity constraints, and opportunities for line balancing. Cycle Time and Takt Time alignment is a fundamental efficiency indicator in lean manufacturing environments.
- Production Cycle Time — Time to complete one unit from start to finish.
- Capacity Utilization Rate — Actual output vs. maximum possible output.
- Schedule Adherence — Percentage of production orders completed on time.
- World-Class OEE Benchmark
- 85 %
- Downtime Reduction with KPI Frameworks
- 45 %
- Average OEE Improvement (18 months)
- 25 %
- Plants Using Real-Time KPI Dashboards by 2026
- 68 %
OEE Deep Dive: The King of Smart Factory KPIs
OEE (Overall Equipment Effectiveness) is universally recognized as the most comprehensive single KPI for smart factory performance. It is calculated as the product of three factors: Availability × Performance × Quality. Each factor reveals a different type of loss, making OEE a diagnostic tool as much as a performance score.
Here is how each OEE component is defined and measured:
- Availability = (Planned Production Time − Downtime) / Planned Production Time. Losses here come from breakdowns and changeovers.
- Performance = (Ideal Cycle Time × Total Count) / Run Time. Losses here come from slow cycles and minor stops.
- Quality = Good Count / Total Count. Losses here come from defects and startup rejects.
A plant with 90% availability, 95% performance, and 98% quality achieves an OEE of 83.8% — close to world-class. The power of OEE lies in its ability to pinpoint exactly where losses occur, enabling targeted improvement actions rather than broad, unfocused initiatives.
In 2026, leading manufacturers are pairing OEE with AI-driven root cause analysis. When OEE dips below threshold, machine learning models automatically correlate the drop with sensor readings, operator shifts, material batches, and environmental conditions — reducing the time to identify root causes from days to minutes.
Supply Chain & Inventory KPIs for Smart Factories
Smart factory performance does not stop at the production line — it extends upstream to suppliers and downstream to customers. Supply chain and inventory KPIs measure how well your plant manages materials, components, and finished goods flows, directly impacting production continuity and working capital.
The most impactful supply chain KPIs for smart manufacturers in 2026 include:
- Inventory Turnover Ratio — How many times inventory is sold and replaced in a period. Higher turnover indicates leaner operations and less capital tied up in stock.
- Days of Supply (DOS) — How many days of production your current inventory can support. Optimal DOS varies by industry but lean manufacturers target 5–15 days for key components.
- Supplier On-Time Delivery (OTD) — Percentage of supplier deliveries arriving on or before the agreed date. A benchmark of 95%+ is standard for Tier-1 suppliers.
- Perfect Order Rate — Percentage of orders delivered complete, on time, damage-free, and with correct documentation. This composite KPI is the gold standard for supply chain excellence.
- Stockout Rate — Frequency of production stoppages caused by missing components. Even a 1% stockout rate can cascade into significant OEE losses.
For a broader view of how AI is transforming supply chain resilience, see our analysis of the best supply chain solutions on the market in 2026.
How to Build a Smart Factory KPI Dashboard That Works
Building an effective smart factory KPI dashboard requires more than assembling charts — it demands a deliberate architecture that serves the right information to the right person at the right level of detail. A well-designed dashboard hierarchy typically has three tiers:
Tier 1: Executive Dashboard
The executive dashboard presents 5–8 top-level KPIs with trend indicators and period-over-period comparisons. It is designed for plant directors and C-suite stakeholders who need a 30-second read on overall plant health. Metrics at this level include OEE, production schedule adherence, quality escape rate, and safety incidents.
Tier 2: Operations Dashboard
The operations dashboard is used by production managers and shift supervisors. It provides line-level visibility with 15-minute to hourly granularity. This tier includes metrics like line efficiency by cell, downtime events by machine, scrap by product family, and labor utilization. Alerts and anomaly flags are critical at this level.
Tier 3: Operator Dashboard
The operator dashboard is a real-time display at the machine or workstation level. It shows current cycle time vs. target, quality check results, and immediate maintenance alerts. Simplicity is paramount — an operator should be able to read and act on this dashboard in under 10 seconds.
The technology stack for a smart factory dashboard in 2026 typically combines a data historian (OSIsoft PI, Ignition), a BI layer (Power BI, Tableau, or a purpose-built MES analytics module), and an alerting engine that pushes notifications via mobile or plant floor displays. For manufacturers already running ERP systems, integration is the key challenge — a topic covered in depth in our ERP integration with AI guide for manufacturers.
| Dashboard Tier | Primary Users | Update Frequency | Key KPIs | Display Format |
|---|---|---|---|---|
| Executive | Plant Director, C-Suite | Daily / Weekly | OEE, Revenue, Quality Escapes, Safety | Summary cards, trend lines |
| Operations | Production Manager, Shift Supervisor | Every 15–60 min | Line Efficiency, Downtime Events, Scrap Rate | Line charts, alerts, heatmaps |
| Operator | Machine Operator, Technician | Real-time (< 1 min) | Cycle Time, Quality Check, Machine Status | Traffic lights, gauges, counters |
AI and Predictive Analytics: The Next Frontier for Factory KPIs
In 2026, the most advanced smart factories are moving beyond descriptive KPIs (what happened) toward predictive KPIs (what will happen) powered by machine learning and AI. This shift fundamentally changes how manufacturers use performance data — from post-mortem analysis to proactive intervention.
Predictive KPI frameworks use historical sensor data, process parameters, and external variables (weather, supplier lead times, energy prices) to forecast future performance with high accuracy. The most impactful predictive applications include:
- Predictive OEE Scoring — AI models forecast next-shift OEE based on current machine health indicators, enabling preemptive maintenance scheduling before failures occur.
- Quality Prediction — Multivariate models trained on process parameters predict defect probability in real time, allowing operators to adjust settings before defective units are produced.
- Demand-Driven Production Scheduling — AI-optimized schedules dynamically adjust production plans based on real-time demand signals, inventory levels, and machine availability.
- Energy Consumption Forecasting — Predictive energy KPIs help plants shift production loads to off-peak hours, reducing energy costs by 10–20% without impacting output.
The integration of AI into KPI frameworks is not just a technology upgrade — it is a fundamental shift in manufacturing strategy. Plants that successfully implement predictive KPIs report a 30% reduction in quality escapes and a 25% improvement in schedule adherence compared to those relying solely on historical reporting.
The factories winning in 2026 are not those with the most sensors — they are those who have built the organizational capability to act on what the data tells them, before problems occur.
— Dr. Andreas Weber, Industry 4.0 Research Director, Fraunhofer Institute
- Smart Factory KPIs
- Availability & Uptime
- Quality & Defects
- Throughput & Efficiency
- Supply Chain
- AI & Predictive
- OEE
- MTBF / MTTR
- First Pass Yield
- DPMO
- Cycle Time
- Capacity Utilization
- Inventory Turnover
- Supplier OTD
- Predictive OEE
- Quality Prediction
Common Mistakes When Implementing Smart Factory KPIs
Even well-resourced manufacturers frequently make the same implementation mistakes when rolling out smart factory KPI programs. Identifying these pitfalls early can save months of wasted effort and significant technology investment.
The most common mistakes — and how to avoid them — are:
- Tracking too many KPIs at once — Organizations that monitor 50+ metrics simultaneously often find that no single metric gets the attention it deserves. Best practice is to start with 8–12 core KPIs and expand only when each metric has a clear owner and action plan.
- Measuring without acting — A KPI without a corresponding response protocol is just a number. Every KPI must have a defined threshold, an alert mechanism, and a documented escalation path.
- Ignoring data quality at the source — AI-driven analytics are only as good as the underlying data. Sensor calibration, network reliability, and data cleansing processes must be established before any analytics layer is built.
- Siloing KPIs by department — When maintenance, quality, and production each track their own metrics in isolation, systemic issues that cross department boundaries remain invisible. A unified data platform is essential.
- Skipping the baseline — Without a documented baseline, it is impossible to demonstrate improvement. Always establish a 30–90 day baseline measurement period before launching any improvement initiative.
- Focusing on lagging indicators only — Lagging KPIs (like monthly defect rates) tell you what went wrong. Leading KPIs (like real-time vibration anomaly scores) tell you what is about to go wrong. A balanced framework needs both.
Smart Factory KPI Implementation Roadmap: From Data to Decision
A successful smart factory KPI program follows a structured implementation roadmap that moves from data infrastructure to strategic decision-making in four distinct phases. Each phase builds on the previous, ensuring that technology investments are grounded in operational reality.
- Data Infrastructure & Baseline — Audit existing sensors and data sources. Connect IoT devices to a central data historian. Establish 30-day baseline KPI measurements for OEE, quality, and throughput.
- KPI Framework Design — Define 8–12 core KPIs aligned to business objectives. Assign metric owners. Set performance targets and alert thresholds. Design the three-tier dashboard architecture.
- Dashboard Deployment & Training — Deploy executive, operations, and operator dashboards. Train all user groups. Run a 2-week parallel operation period to validate data accuracy and usability.
- Predictive Analytics & Continuous Improvement — Integrate AI models for predictive OEE and quality forecasting. Establish weekly KPI review cadence. Launch first improvement sprints targeting the lowest-performing metrics.
- What is the most important KPI for a smart factory?
- OEE (Overall Equipment Effectiveness) is widely considered the most important KPI for smart factories. It combines availability, performance, and quality into a single score that reflects the true productive capacity of your manufacturing assets. A world-class OEE benchmark is 85%, though most plants start between 40–60% and improve systematically from there.
- How many KPIs should a smart factory track?
- Best practice recommends tracking 8–12 core KPIs at the plant level, organized into categories such as availability, quality, throughput, and supply chain. Tracking too many metrics simultaneously dilutes focus and makes it harder to drive meaningful improvement. Start with a focused set, assign clear owners, and expand the framework as operational maturity grows.
- What is the difference between OEE and TEEP?
- OEE (Overall Equipment Effectiveness) measures efficiency relative to planned production time, while TEEP (Total Effective Equipment Performance) measures efficiency relative to all available calendar time (24/7/365). TEEP is always lower than OEE and reveals the true maximum utilization potential of your assets, including time lost to planned shutdowns and non-scheduled periods.
- How do AI and machine learning improve smart factory KPIs?
- AI and machine learning transform factory KPIs from descriptive (reporting what happened) to predictive (forecasting what will happen). ML models trained on historical sensor data can predict equipment failures before they occur, forecast quality defects in real time, and optimize production schedules dynamically. Leading manufacturers report 30% fewer quality escapes and 25% better schedule adherence after implementing AI-driven predictive KPI frameworks.
- What tools are used to build smart factory KPI dashboards?
- Smart factory KPI dashboards typically combine three technology layers: a data historian (such as OSIsoft PI or Inductive Automation Ignition) for collecting and storing sensor data, a BI visualization layer (such as Power BI, Tableau, or a purpose-built MES analytics module) for building dashboards, and an alerting engine for real-time notifications. ERP integration is also critical for connecting production KPIs with financial and supply chain data.
- How long does it take to implement a smart factory KPI program?
- A structured smart factory KPI implementation typically takes 12–16 weeks from data infrastructure setup to full dashboard deployment with predictive analytics. Phase 1 (data infrastructure and baseline) takes 4 weeks, Phase 2 (KPI framework design) takes 4 weeks, Phase 3 (dashboard deployment and training) takes 4 weeks, and Phase 4 (predictive analytics and continuous improvement launch) takes an additional 4 weeks.
Start Measuring What Matters: Your Smart Factory KPI Action Plan
Smart factory KPIs are not a technology project — they are a management discipline that happens to be enabled by technology. The manufacturers who achieve lasting performance improvements are those who embed KPI-driven decision-making into their daily operating rhythm: from the morning shift handover to the monthly executive review.
To get started, prioritize these three actions in your first 30 days:
- Audit your current data sources — Identify which machines already generate digital data and which require sensor retrofits. Map the gap between your current visibility and the KPIs you want to track.
- Define your top 5 KPIs — Choose metrics directly tied to your most pressing operational challenge, whether that is unplanned downtime, quality escapes, or delivery performance. Resist the temptation to measure everything at once.
- Build a baseline — Collect 30 days of consistent data before setting targets or launching improvement initiatives. A credible baseline is the foundation of every successful KPI program.
The journey from a conventional plant to a truly data-driven smart factory takes time, but the competitive advantages — lower costs, higher quality, faster response to market changes — compound significantly over 2–3 years. The best time to start is now.